Currently reading: UK new car sales: what is each region buying?

BMW's big in Yorkshire, while Ford reigns in the East. But the numbers don't always tell the whole story

The Scots love Vauxhall but don’t buy a lot of Mercedes'. Volvo and BMW are both phenomenally popular in Yorkshire and Humber but they’re not fussed about Vauxhall. Ford kills it in Wales and the East of England. 

Every year the Department for Transport puts out registration figures for the UK’s regions broken down by brands and at a glance it broadly follows our national buying tastes in 2018: Ford on top, followed by VW, Vauxhall, Mercedes, BMW and Audi. But If you compare market share nationally with those of the 12 regions the DfT divides us up into, you get these weird anomalies.

“One of the more obvious is that in the UK we’re loyal to brands that build or once built cars near us,” says Tristan Young, editorial director of sales analyst firm Auto Retail Network. Hence Jaguar Land Rover’s huge spike in the West Midlands, Ford’s dominance in the East, Nissan’s rise to fourth in the North East and Honda’s hike in the South West. Discounted sales to employees help too.

Other tastes are more locale specific. The popularity of Toyota’s hybrids in London for example boosted its share there by 72 percent compared to its national average (all those Ubers). Wealthier Londoners also love their Porsches.

The reason for some spikes are more arcane. All BMW’s new employee and lease cars are registered in its Thorne preparation centre in Doncaster, hence its seeming popularity in Yorkshire. Similarly, disproportionately more VW Group cars are registered in the South East, a region that includes its UK base in Milton Keynes.
Dsc 3490

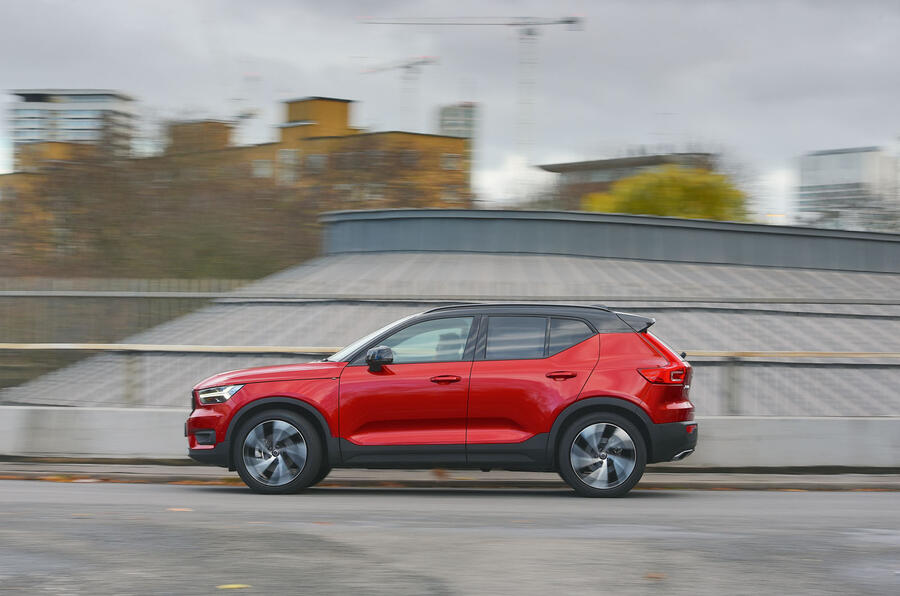
Volvo’s tremendous spike in Yorkshire (+243% to put it fourth) meanwhile is because all cars leased through Volvo Car Financial Services are registered in Leeds, the company told us. Which dashes our theory that XC60s are now as Yorkshire as rhubarb.

Most popular brands by region (figures from the DfT):

(Outliers calculated by comparing the national market share with the regional share)

Back to top

North East

1. Ford 7,100

2. Vauxhall 6,600

3. VW 6,000

4. Nissan 4,600

5. BMW, Audi = 3,600

Outliers

Wanted: Nissan +52% 

Unwanted: Peugeot -32%

Dsc 4761

North West

1. Ford 28,600

2. BMW 19,100

3. VW 18,300

4. Vauxhall 17,000

5. Audi 16,700

Outliers

Wanted: Ford +15%

Unwanted: Volvo -48%

Yorkshire and the Humber

1. BMW 24,500

2. Ford 14,500

3. Mercedes 13,500

4. Volvo 13,400

5. VW 13,000

Back to top

Outliers

Wanted: BMW +83%, Volvo +243%

Unwanted: Vauxhall -26%

330i uk 2019 1911e

East Midlands

1. Ford 17,600

2. Vauxhall 17,100

3. Mercedes 17,000

4. VW, 15,800

5. Toyota 9,100

Outliers

Wanted: Fiat +47%

Unwanted: BMW -32%

West Midlands

1. Ford 27,300

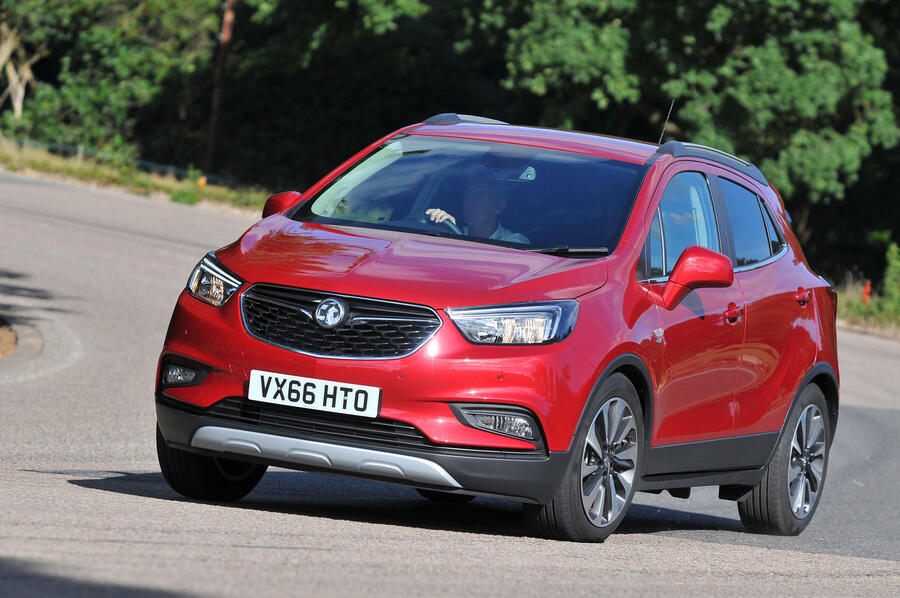
2. Vauxhall 23,800

3. BMW 18,200

4. Peugeot 17,700

5. VW 16,800

6. Land Rover 16,100

Outliers

Wanted: Land Rover +88%, Peugeot +103%, Jaguar +137%

Unwanted:  Hyundai -39%, VW -23%

Back to top

Dsc 7213

East

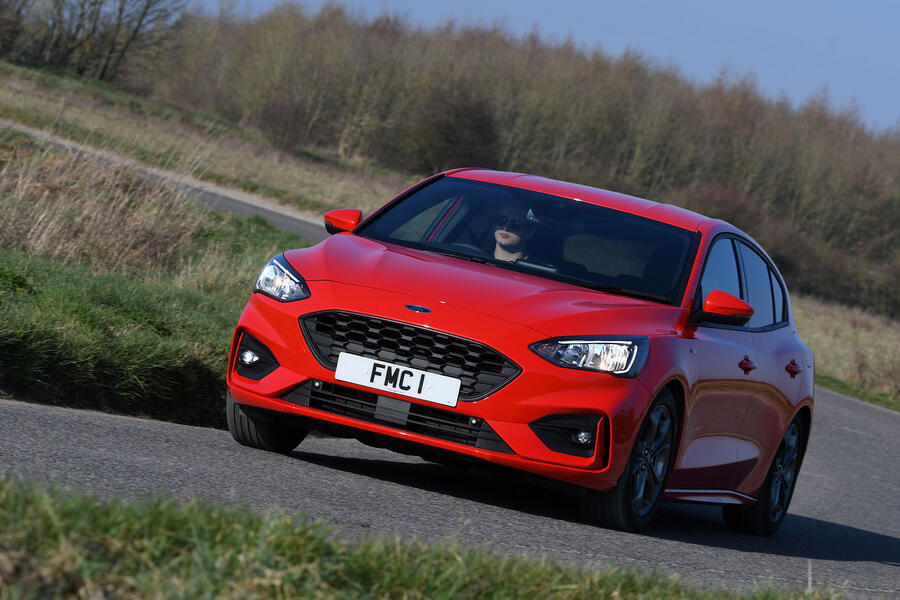
1. Ford 40,900

2. BMW 22,000

3. VW 15,300

4. Mercedes 13,100

5. Audi 12,800

Outliers

Wanted: Ford +66%

Unwanted: Hyundai -32%

London

1. Ford 13,500

2. Vauxhall, Mercedes = 15,200

3. Toyota 12,200

4. VW 11,000

Outliers

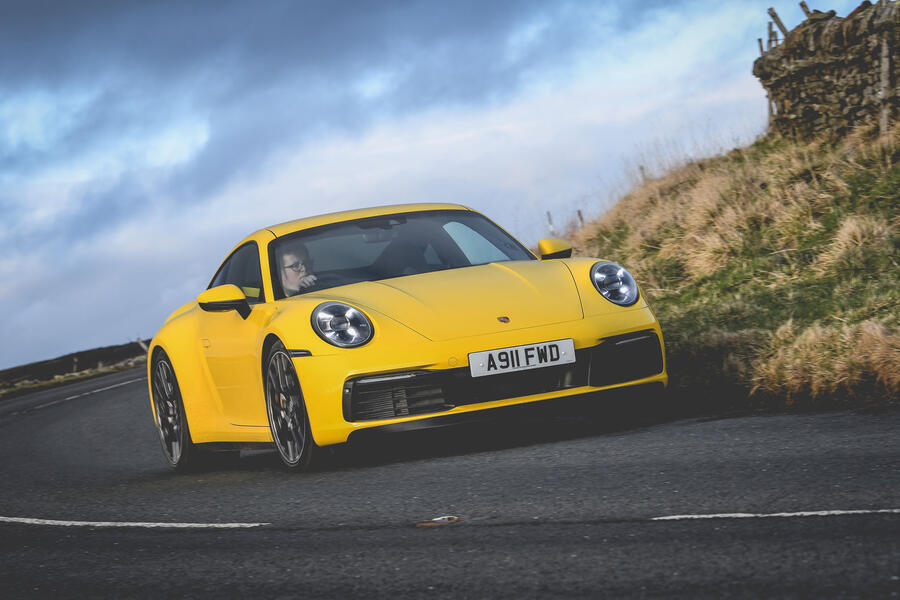
Wanted: Toyota +72%, Porsche +160%

Unwanted: Citroen -57%, Seat -42%

992 911 C4s 2019 2626x

Back to top

South East

1. VW, 60,500

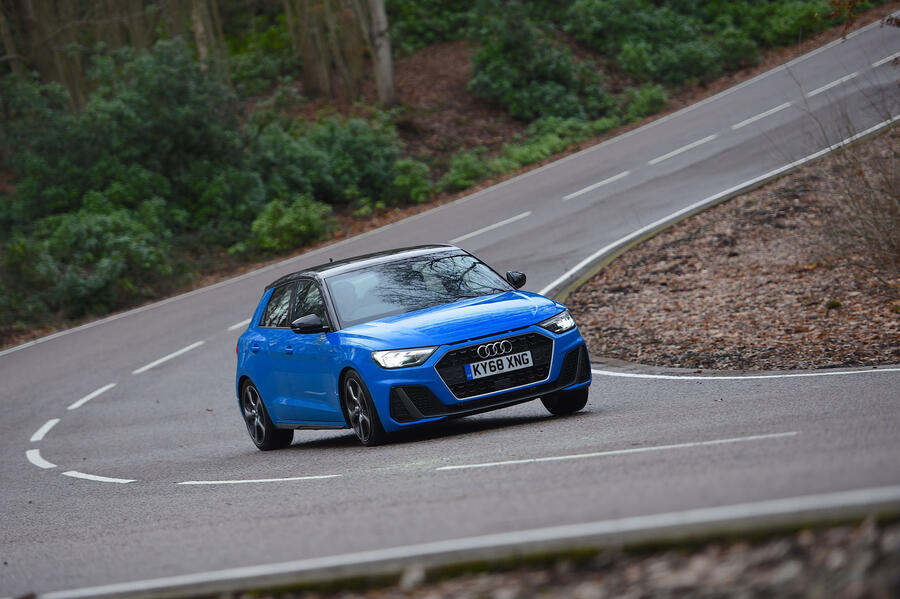
2. Audi 47,800

3. Ford 44,800

4. Mercedes 42,100

5. Vauxhall 31,300

Outliers

Wanted: VW +40%, Audi +57%, +Skoda +42%, Seat +54%

Unwanted: Mini -25%, BMW -29%

South West

1. Mercedes 25,200

2. BMW 23,800

3. Ford 22,800

4. VW 19,800

5. Kia 18,800

Outliers

Wanted: Kia +82%, Honda +104%

Unwanted: Toyota -34%

A1 30tfsi 2019a 0268b

Wales

1. Ford 13,300

2. VW 6,500

3. Vauxhall 5,700

4. Mercedes, Audi = 3,800

Outliers

Wanted: Ford +54%, Suzuki +119%

Unwanted: Audi -33%

Scotland

1. Vauxhall 20,800

2. Ford 20,000

3. VW 15,700

4. BMW 11,100

5. Audi 10,000

Outliers

Wanted: Vauxhall +50%

Unwanted: Mercedes -39%

Northern Ireland

1. Ford 6,700

2. VW 5,400 

3. Hyundai 3,100

4. Vauxhall, BMW 3,000

Outliers

Wanted: Hyundai +55%

Unwanted: Mercedes -49%, Mini -39%

Nick Gibbs

Read more

New car sales fall in April, plug-in hybrids hardest hit​

New Cars 2019: What's coming and when?​

Mitsubishi calls for plug-in hybrid grant to be reinstated​

Join our WhatsApp community and be the first to read about the latest news and reviews wowing the car world. Our community is the best, easiest and most direct place to tap into the minds of Autocar, and if you join you’ll also be treated to unique WhatsApp content. You can leave at any time after joining - check our full privacy policy here.

Join the debate

Comments
1
Add a comment…
pablovski123 14 May 2019

Terrible analysis

What’s the point? You’ve already identified issues with cars being registered by the manufacturers and you’ve made no effort to reflect the size of the population or the associated dealership presence in those regions. Hope to god you’re analysts aren’t in charge of your finances...