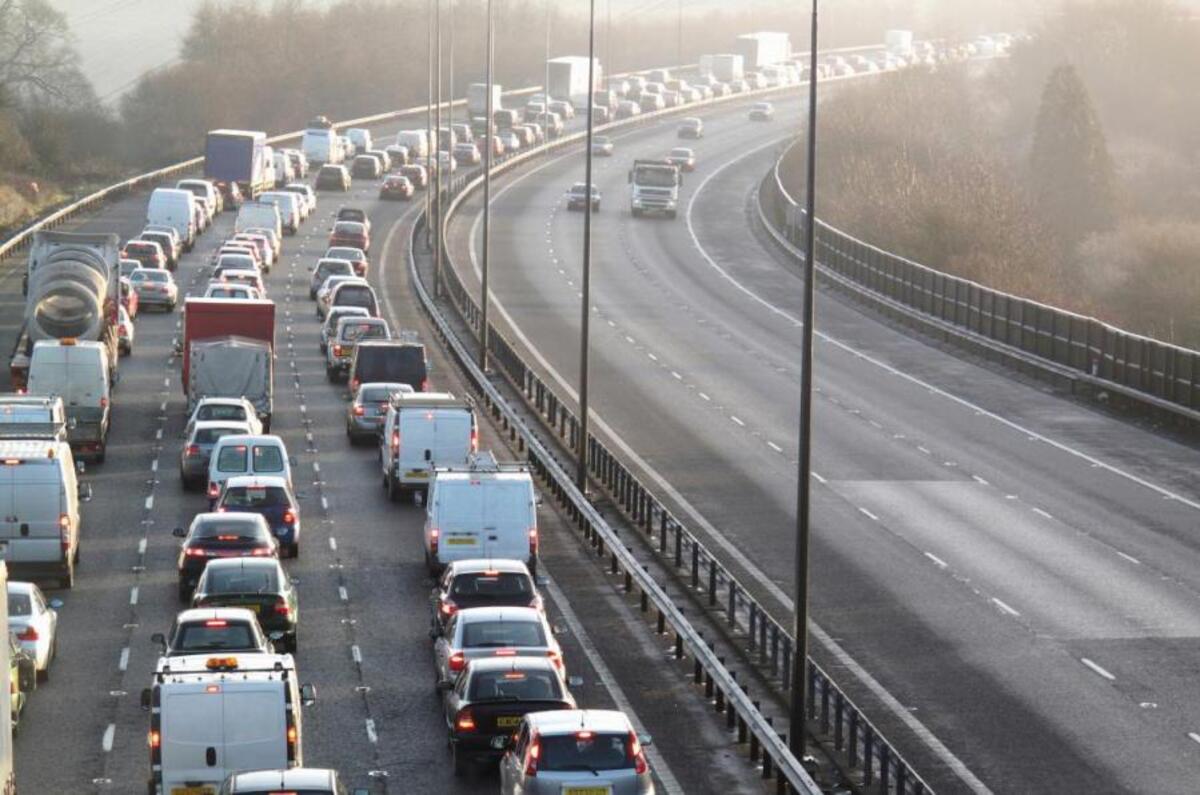
The average speed on the UK’s A-roads in the past 12 months was 25.5mph, putting into context the level of congestion across the country.
UK drivers sat in traffic for an average of 45sec for each mile they drove in March, according to the latest figures from the Department for Transport (DfT). This increased to 1min 24sec for every mile when driving on urban A-roads.
The latest 12-month rolling statistics show that travelling during weekday evenings has the greatest impact on average speeds on A-roads, pushing it down to a 22.5mph crawl for the commute home. Urban roads show an even lower average, at 18.7mph, while rural roads have the highest average speed, at 36.9mph.
The average speed across the whole of England’s Strategic Road Network has reduced from 60.6mph in April 2015 to 59.5mph in March this year.
The DfT’s provisional estimates show vehicle traffic in the UK increased by 1.8% to 318.5 billion miles travelled between April 2015 and March 2016.
Commute will only get worse
The government has earmarked £15bn for its Road Investment Strategy in order to roll out 100 road improvement projects over the course of this parliament and the next.
A total of more than 1300 new lane miles will be added through the schemes, which will address traffic black-spots such as the A303 at Stonehenge in Wiltshire and the remaining single-lane sections of the A1.
A spokesman for The AA said: “The stats are moving in the wrong direction and commuting time is only going to get worse, particularly if you’re using urban A-roads to connect to the motorway for your journey.
“Unfortunately the £15bn isn’t going to help the urban A-roads improve as most of it will be spent on major projects. This leaves local authorities to improve these A-roads, and they don’t have the funds to do this.”
Provisional estimates indicate car traffic was higher than ever before on motorways and minor rural roads in the year ending March 2016.
Rolling annual motor vehicle traffic has now increased for each quarter in succession for three years. Van traffic continued to rise faster than any other vehicle type, increasing by 4.1% to a peak of 47.3bn vehicle miles.
Motorway traffic increased by 3% to 67.1bn vehicles miles and rural A-road traffic increased by 3% to 92bn miles, with both at their highest recorded levels.


Join the debate
Add your comment
I like what the Netherlands do.
Have you ever driven in the middle of a working day?
As Centenary has already said, the office hours culture has to change.
It seems ridiculous that so many of us sit in traffic to then sit at a desk staring at a computer.
A combination of flexible working and working from home should reduce the road usage in the short term.
In the long term I envisage that everyone rents a desk at an office within walking distance of their home to then sign into their employer's virtual office.
None of this addresses the school run though which is the most unnecessary build up of traffic - most people live within walking distance of their child's primary school but choose to use their car.
Its about Public transport and road pricing