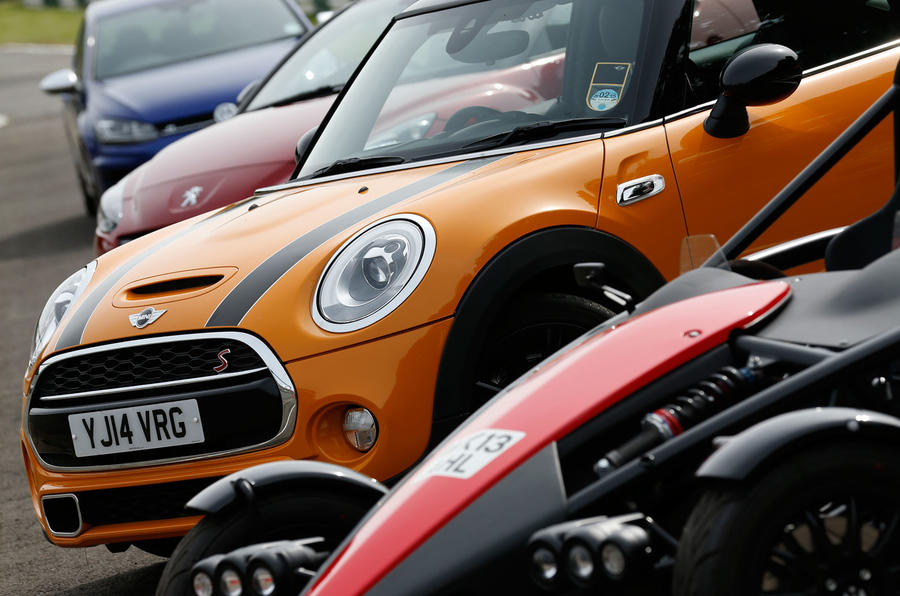
There’s a summer treat coming over the next couple of weeks: a series of articles comparing 2014’s best affordable driver’s cars.
All were written on the back of what we’ve come to call our ‘junior handling day’ test here at Autocar HQ: something we’ve made a habit of doing at this time of year, with the motorsport season in full swing, the weather good, the holiday season well and truly open and ours roads that little bit clearer.
These are the usual cues to start daydreaming about buying a real-world performance machine. Read next week’s issue – or just keep coming here every few days as the summer blazes on – and you’ll know which the good ones are and which the not-so-good.
Meantime, if you can’t wait that long, I’m wondering if we can arrive at a way to work out how much fun any given sporting purchase will give you for your money? A good way, that is – because I’ve had a go for next week’s issue, and I’m not sure it’s very good. My mathematics is about as good as my lawn green bowling.
Still, it’s a way. We’ve called it the Autocar Affordable Performance Index. And because – broadly speaking – it sorted the better cars from the rest in our test field the other day, it may just help you decide which bargain driver’s car to splash out on. Maybe.
Take the sum of your car’s top speed and power to weight ratio, and divide by the sum of its horsepower-per-pound-sterling quota, insurance group and 0-62mph sprint time. Bingo.
That way you’re considering a lot of the things that make a bargain performance car appealing, without having to drive it to decide if it’ll be any good. Needless to say, we do recommend you ultimately drive one; there’s no way to account for personal taste, usability or handling brilliance here.
Here’s the list of ‘AAPI’s’ for the cars we tested, plus a few ‘controls’ to prove it works – after a fashion:


Join the debate
Add your comment
Order and subjective
Without plotting numbers I guess the cost rises exponentially to performance. So you are better plotting cost against your measure of pleasure and seeing which cars are above or below "average". How you define the "average" will depend on what you want to include in the base that could be all cars or limited to "performance cars". I would suggest a single measure of pleasure could be something like the level of G force, you could do this for a straight line from published figures but you would really want to do it round a bend.
You should really only include cars that you could drive to work in the wet as well. It is a British summer after all. Then again pleasure is very subjective.